1DocTrack
$
Billing analytics & revenue intelligence

Know exactly how your group is doing β€” every month, with 95% confidence.

Drop in your biller's month-end reports. 1DocTrack reads them, checks every billed encounter against your own daily census, forecasts what each month of service will finally collect, flags payers that drift, and lays revenue, physician cost and margin side by side β€” by month, quarter, fiscal year, or any span of years. Below are real screens of the product running on demonstration data: the layout and logic are exactly what a group sees, the numbers, payers and physician names are synthetic.

Nothing goes unbilledCensus patient-days vs. billed encounters, overall and per physician, so a forgotten charge shows up in days, not at year end.
Collections forecastEach month of service gets a projected final collection amount with a 95% range, learned from how earlier months matured.
Payer driftEvery payer against its own usual band β€” the one that quietly starts paying less is flagged.
Cost and marginPhysician cost from payroll, the hospital stipend, and collections on one chart, so margin is a number, not a feeling.
A written answerEach report opens with a plain-English "how we are doing" paragraph, generated from the numbers, plus a flag list.
Works with any billerMonth-end packs from a billing service or practice-management system are read as-is; history from a previous biller can be loaded too.

The monthly report

Upload the pack, press Run, and a few minutes later: narrative, flags, headline tiles, and seven charts β€” encounters vs. census, collections with its 95% band, days to bill, revenue vs. cost, AR aging, the collections forecast, and payments by payer. Metric bands and a per-physician table follow.
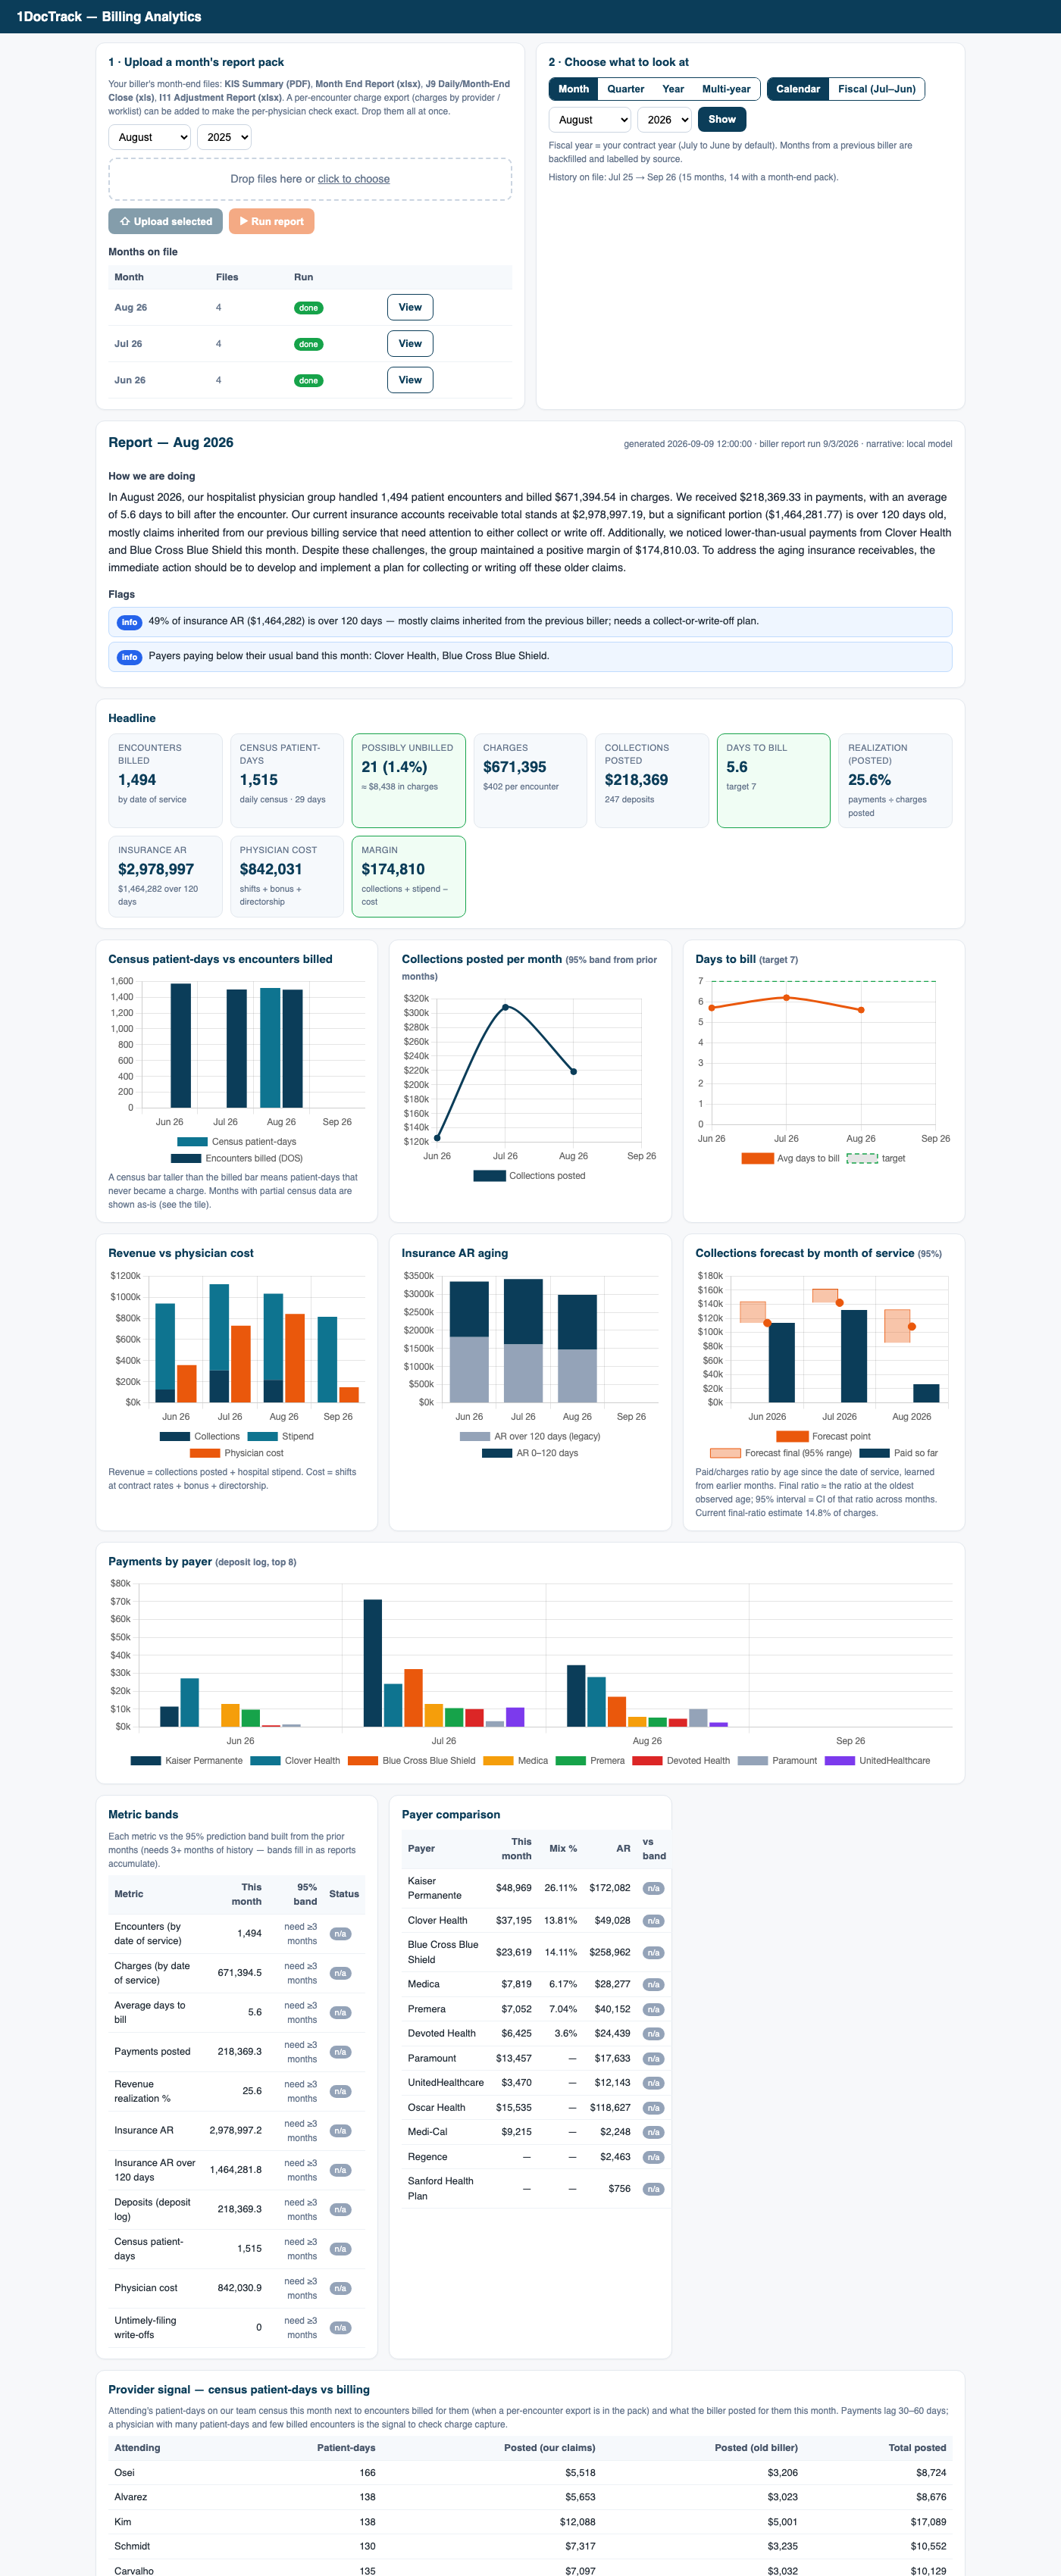
1DocTrack Billing Analytics β€” monthly report with narrative, flags, headline tiles and charts
Product screen, August report, demonstration data. No patient data appears anywhere in the product's analytics.

A whole fiscal year at a glance

Pick a quarter or a year, calendar or fiscal, and every metric aggregates with a Β± confidence interval and the change against the previous period. Months from a previous biller are backfilled and labelled by source, so the history is continuous even after switching billers.
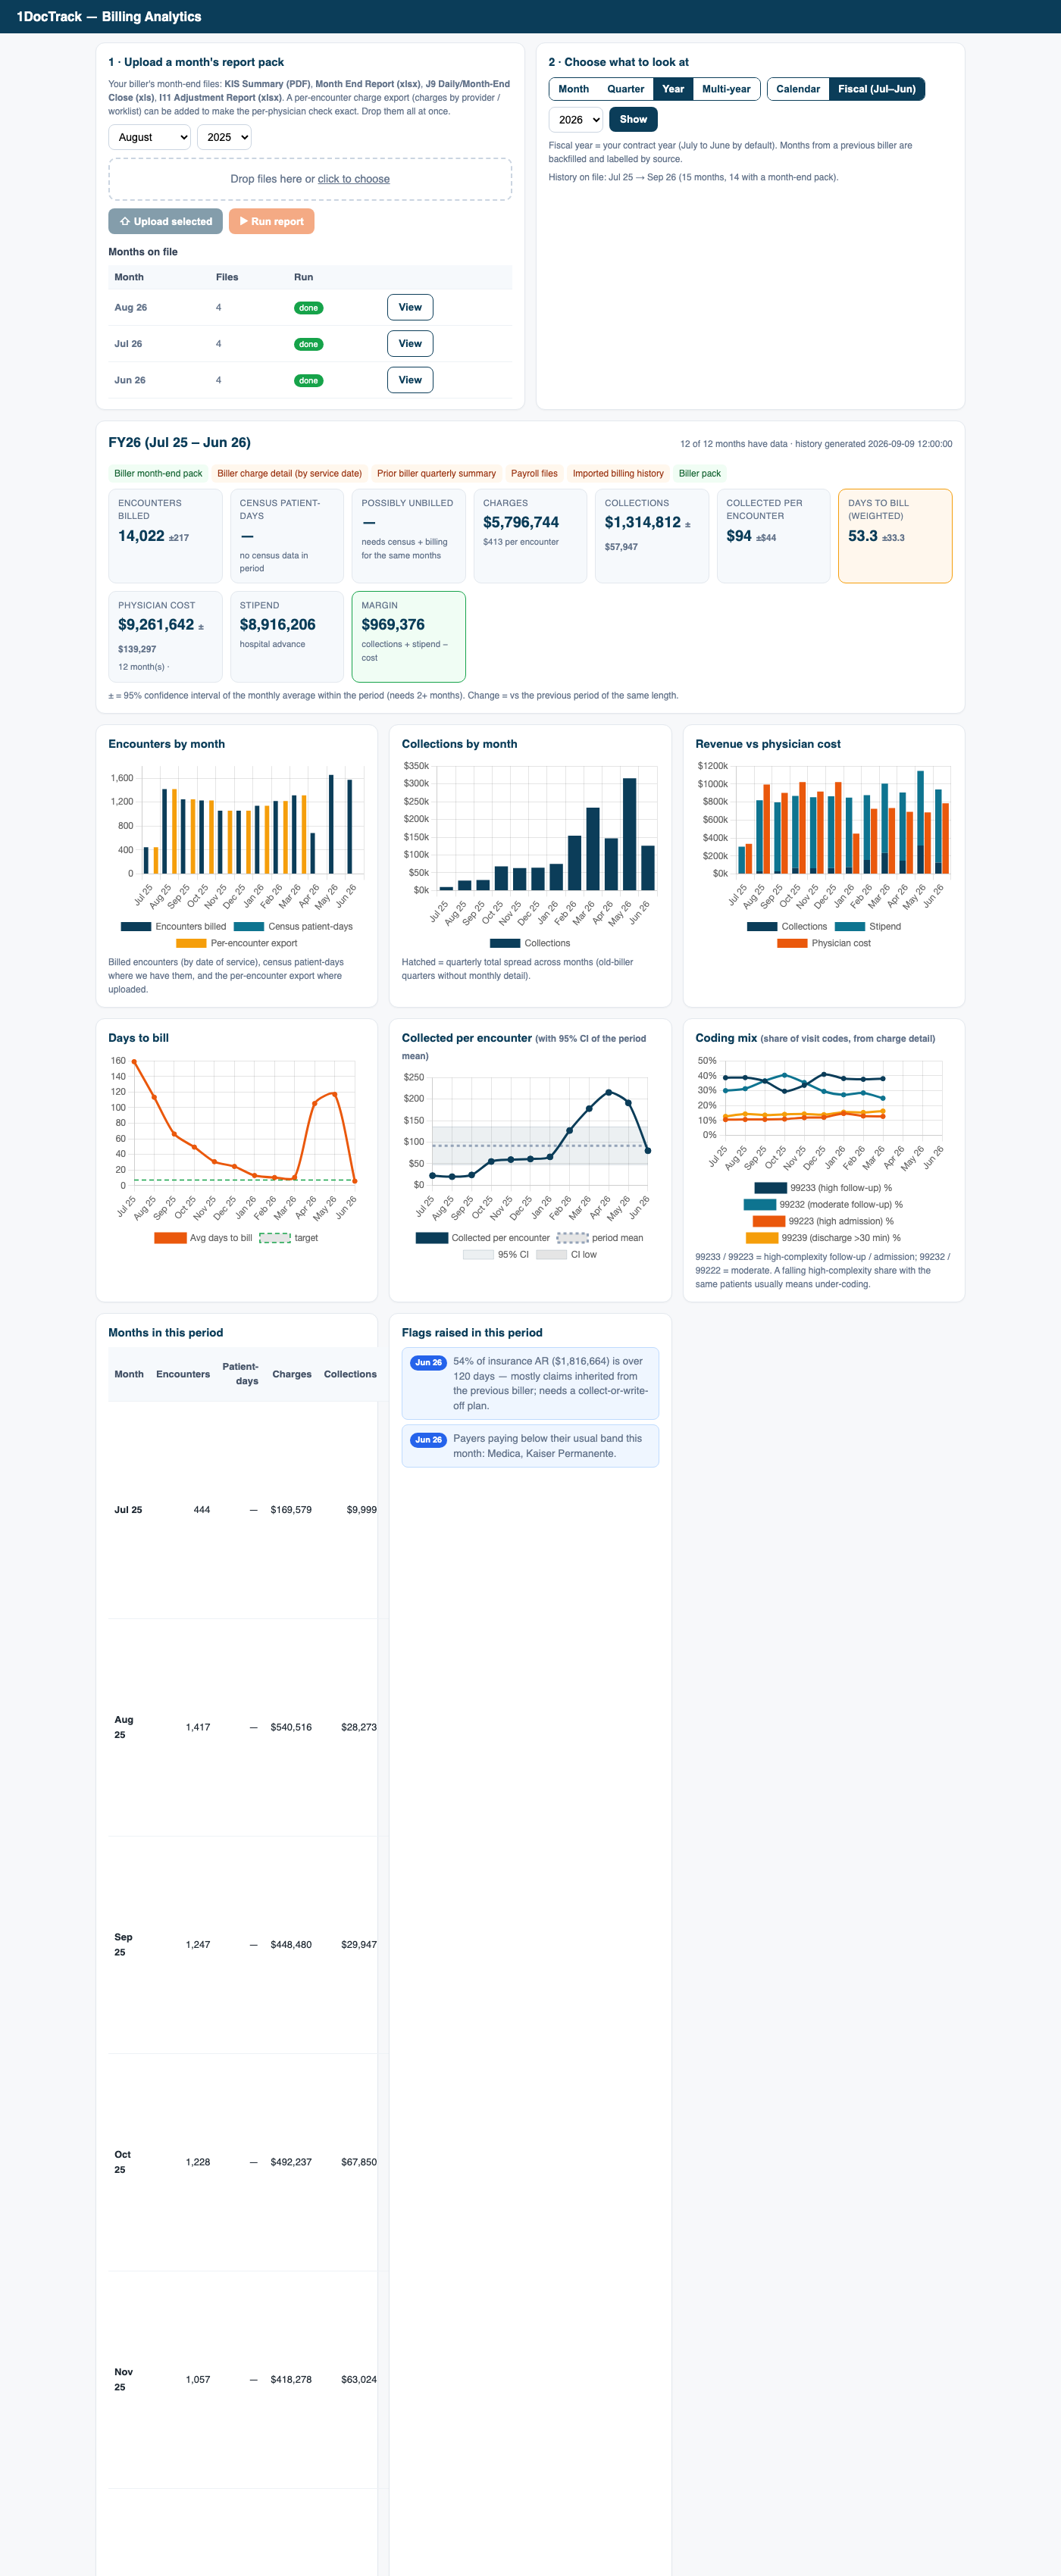
1DocTrack Billing Analytics β€” fiscal year view with confidence intervals, monthly charts, coding mix
Product screen, FY26 (July–June), demonstration data. The coding-mix chart comes from charge detail and catches under-coding early.

Year over year

The multi-year view compares any span of years side by side β€” encounters, collections, physician cost and margin per year, each with its own interval β€” and lists every month underneath with the flags it raised.
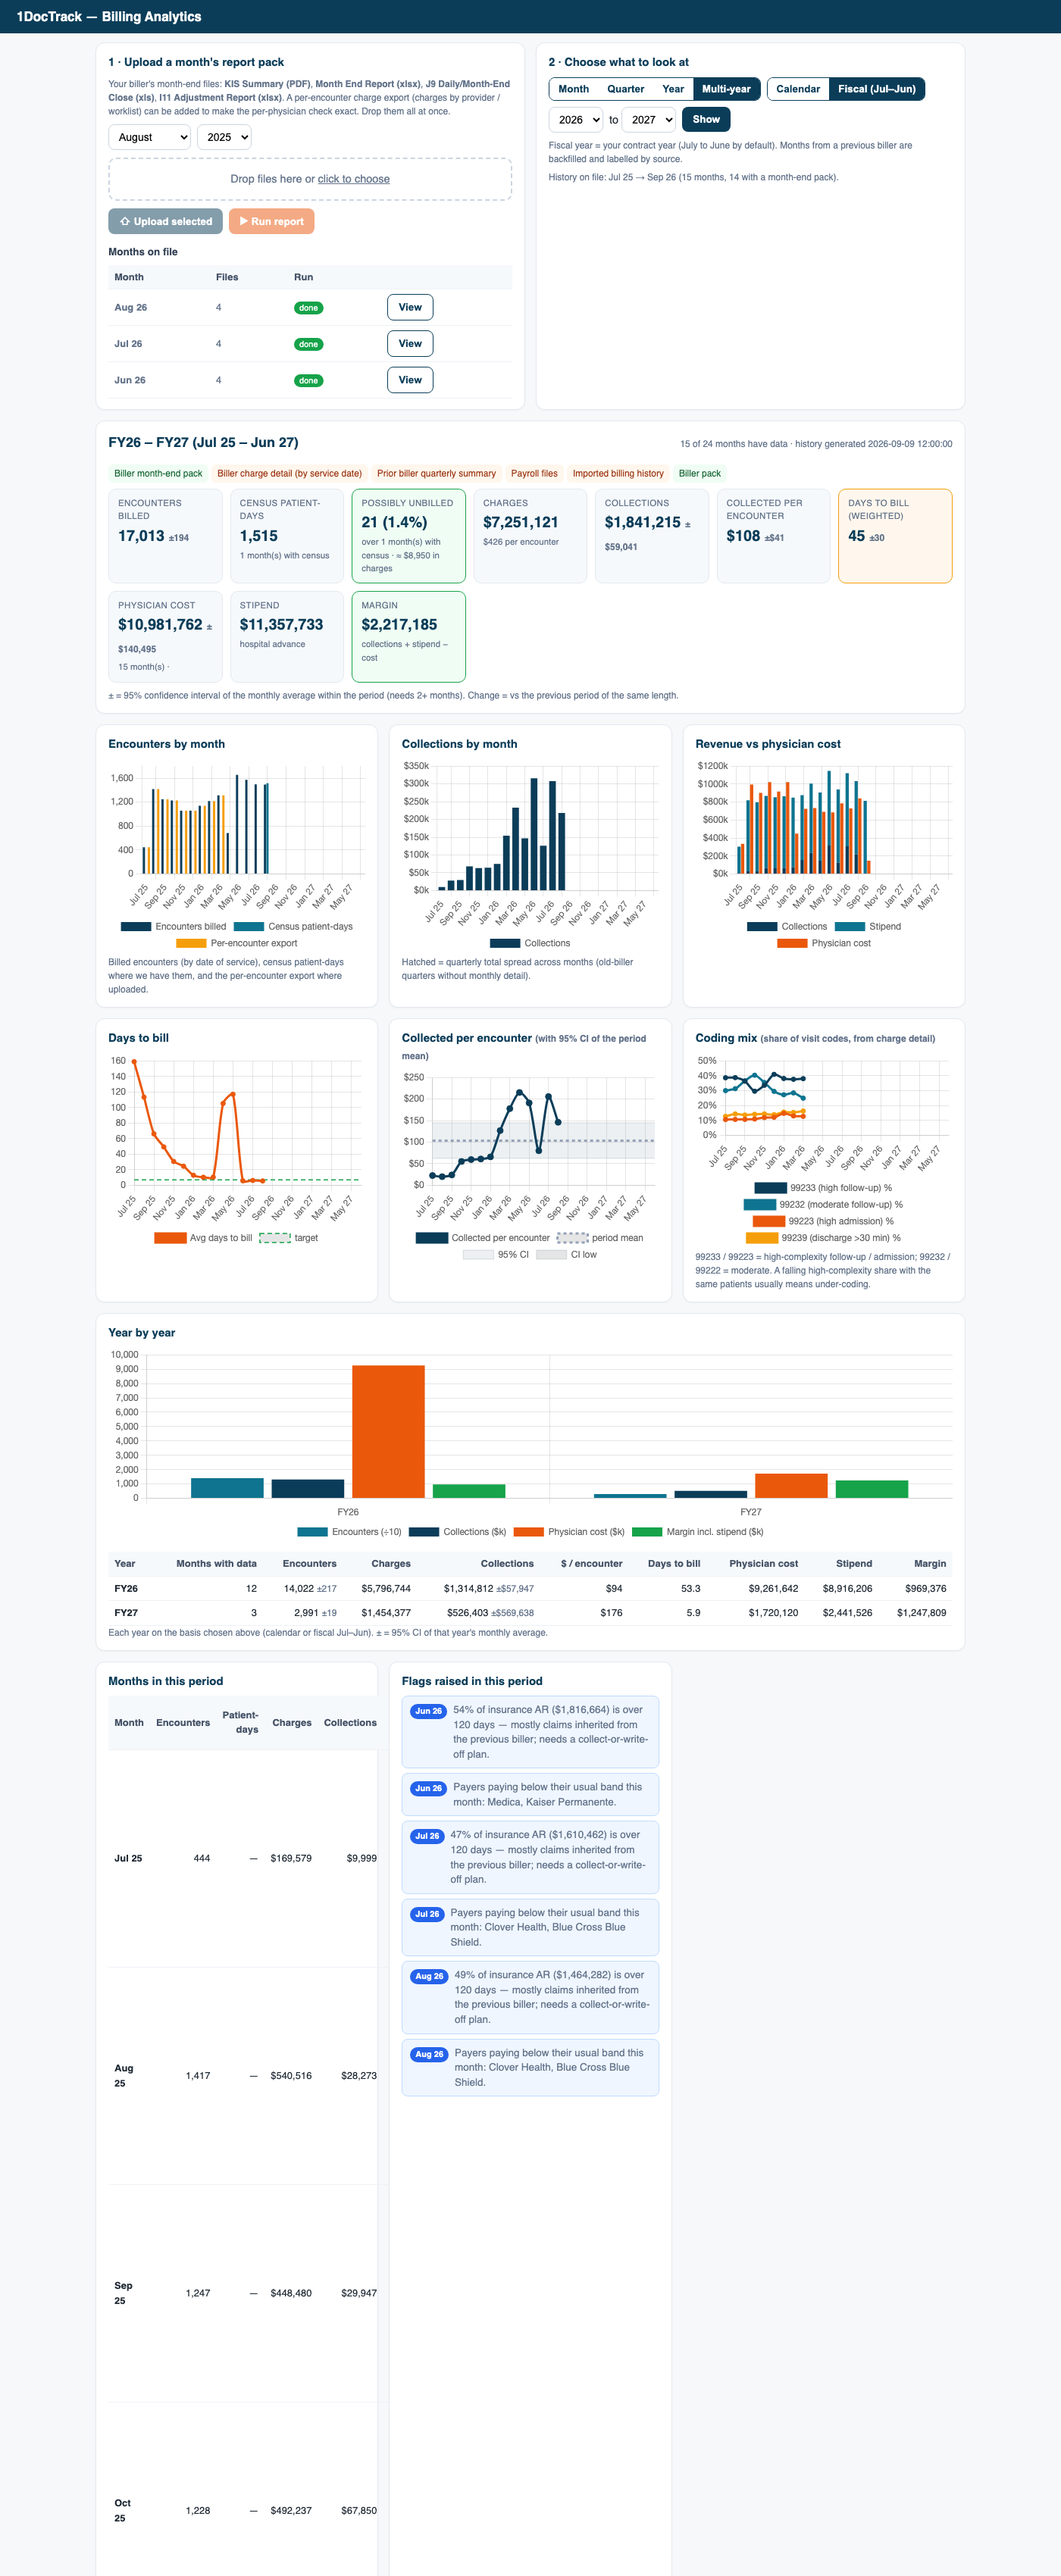
1DocTrack Billing Analytics β€” multi-year comparison with year-by-year chart and table
Product screen, FY26–FY27, demonstration data. Years are open-ended: the history keeps growing as long as the group runs on 1DocTrack.

See it with your own numbers.

Send us one month-end pack from your biller and we will show you your group's report on a call.

Get a quote   Watch the tour